Climate & Energy Design Data
Climate Design Data: Barrie, Canada
How to research climate design data for a specific site in Barrie — the controlling authority, source documents, and checks to run before you rely on a number.
On this page
Last updated August 31, 2026 · Location data from the [GeoNames CA dump](https://download.geonames.org/export/dump/CA.zip) (CC BY 4.0, snapshot 2026-08-31, GeoNames ID 5894171). Regulatory starting point: [Codes Canada and the applicable provincial or territorial authority](https://nrc.canada.ca/en/certifications-evaluations-standards/codes-canada/codes-canada-publications). Figures are illustrative — verify against the current locally adopted edition for the site. Climate screening data from the [NASA POWER Climatology API documentation](https://power.larc.nasa.gov/docs/services/api/temporal/climatology/) and [exact point response](https://power.larc.nasa.gov/api/temporal/climatology/point?parameters=T2M%2CT2M_MAX%2CT2M_MIN%2CRH2M%2CPRECTOTCORR%2CWS10M&community=SB&longitude=-79.66634&latitude=44.40011&format=JSON), retrieved 2026-08-31; source period: 20-year Meteorological and Solar Monthly & Annual Climatologies (January 2001 - December 2020). NASA POWER values are gridded screening statistics, not code design conditions or guaranteed local observations.
Direct answer
NASA POWER's 2001–2020 climatology at the Barrie reference point reports an annual mean 2 m temperature of 7.5 °C and relative humidity of 78.7%. The highest monthly maximum is 34.0 °C in August, while the lowest monthly minimum is -29.8 °C in March; these are screening statistics, not code design temperatures. The point response uses LST and the 20-year Meteorological and Solar Monthly & Annual Climatologies (January 2001 - December 2020); its annual corrected precipitation is 1.71 mm/day and annual 10 m wind speed is 3.67 m/s. For climate design data, use the 34.0 °C and -29.8 °C monthly extrema to screen seasonal exposure, then obtain the adopted percentile design conditions. NASA POWER is gridded climatology: verify elevation, microclimate, urban exposure, station or weather-file suitability, current code edition and the authority's required source before design use.
Content and cited inputs reviewed by Harth team · Published 2026-08-26 · Updated 2026-08-31.
What must be verified for Barrie?
Barrie is represented here at approximately 44.4001, -79.6663 for discovery and workflow planning. A project address, parcel, elevation, exposure, authority, and submission date must replace that city-centre reference before design use.
How should climate design data be established?
- Fix the surveyed site and local time basis.
- Select an authoritative weather source or a named solar-position algorithm.
- Record period, percentile or scenario and units.
- Test sensitivity to elevation, exposure, urban form and horizon.
- Save the source file, retrieval date and checker in the model record.
| Input | Project-specific evidence | QA question |
|---|---|---|
| Site | surveyed coordinates, elevation and horizon | Does the point represent the building? |
| Weather/solar method | named dataset, algorithm, period and time basis | Are station, time zone and units explicit? |
| Design scenario | current and future scenario agreed by the team | Is an average being mistaken for an extreme? |
| Compliance | adopted local document and edition | Was applicability confirmed with the authority? |
What are the limits of this worksheet?
This climate-design-workflow page is a project-starting worksheet, not a design value or approval. The controlling authority and qualified professionals for the Barrie site remain authoritative.
Which related searches does this primary location record cover?
This primary route consolidates the location evidence needed for Climate Design Data, Weather File Guide, Overheating Weather Data, Building Climate Checklist. A narrower route should be released only when it adds a materially different official source, calculation, process, threshold or worked example.
Barrie NASA POWER monthly climate screening table
| Month | Mean °C | Monthly max °C | Monthly min °C | RH % | Precipitation mm/day | Wind at 10 m m/s |
|---|---|---|---|---|---|---|
| January | -6.44 | 11.14 | -26.69 | 90.75 | 1.43 | 4.67 |
| February | -6.39 | 11.83 | -28.55 | 89.41 | 1.44 | 4.90 |
| March | -1.68 | 22.80 | -29.79 | 82.68 | 1.56 | 4.34 |
| April | 4.69 | 23.28 | -13.12 | 77.47 | 1.78 | 3.89 |
| May | 11.44 | 30.75 | -2.93 | 75.21 | 1.88 | 3.06 |
| June | 17.35 | 33.53 | 2.81 | 72.16 | 1.87 | 2.77 |
| July | 21.28 | 33.82 | 7.19 | 67.84 | 1.67 | 2.73 |
| August | 20.85 | 33.97 | 9.59 | 68.53 | 1.63 | 2.79 |
| September | 17.09 | 33.05 | 3.48 | 71.10 | 1.71 | 3.00 |
| October | 9.70 | 28.43 | -3.05 | 77.83 | 2.03 | 3.61 |
| November | 3.27 | 20.62 | -11.68 | 82.96 | 1.80 | 3.95 |
| December | -2.62 | 12.74 | -22.87 | 88.88 | 1.65 | 4.34 |
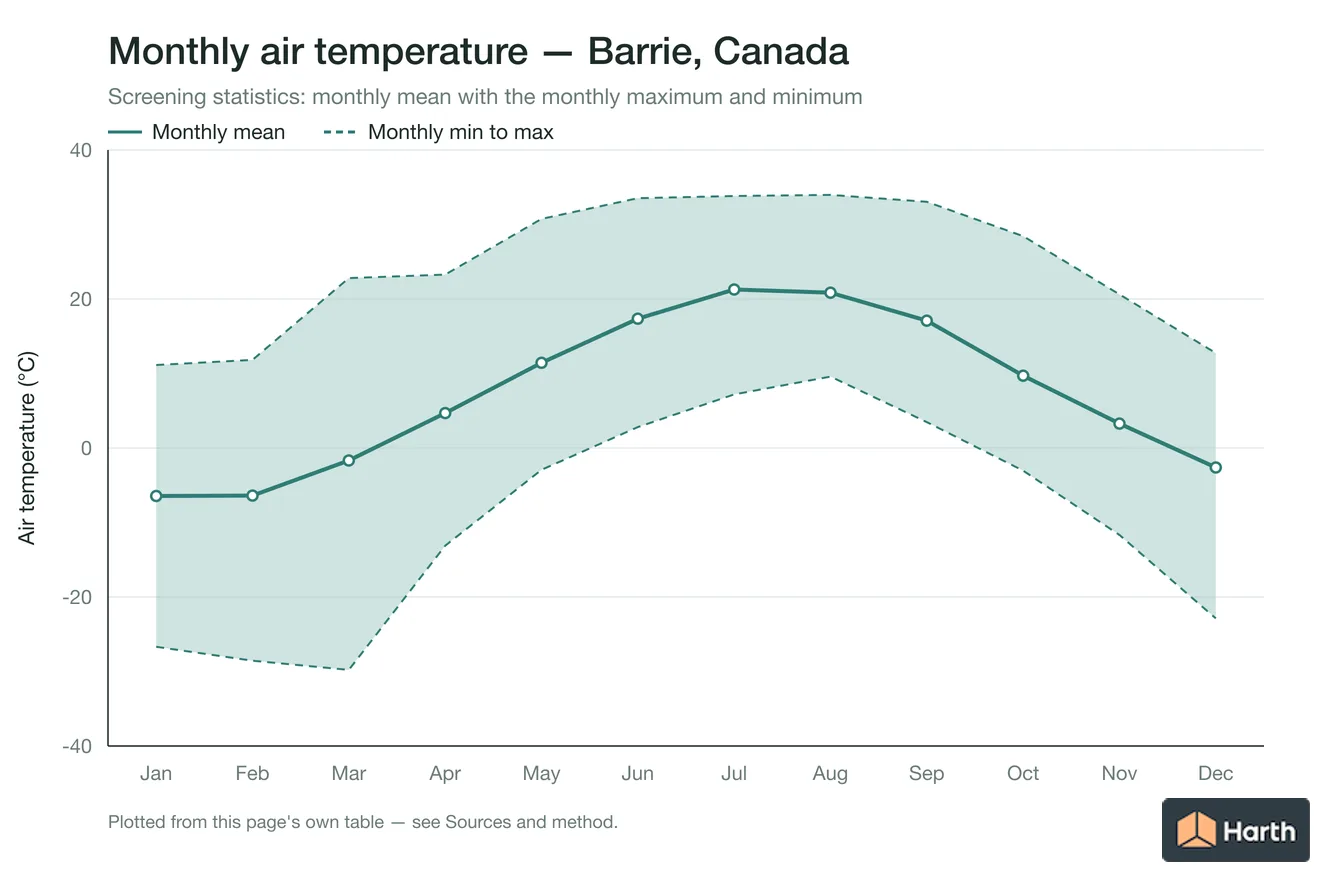
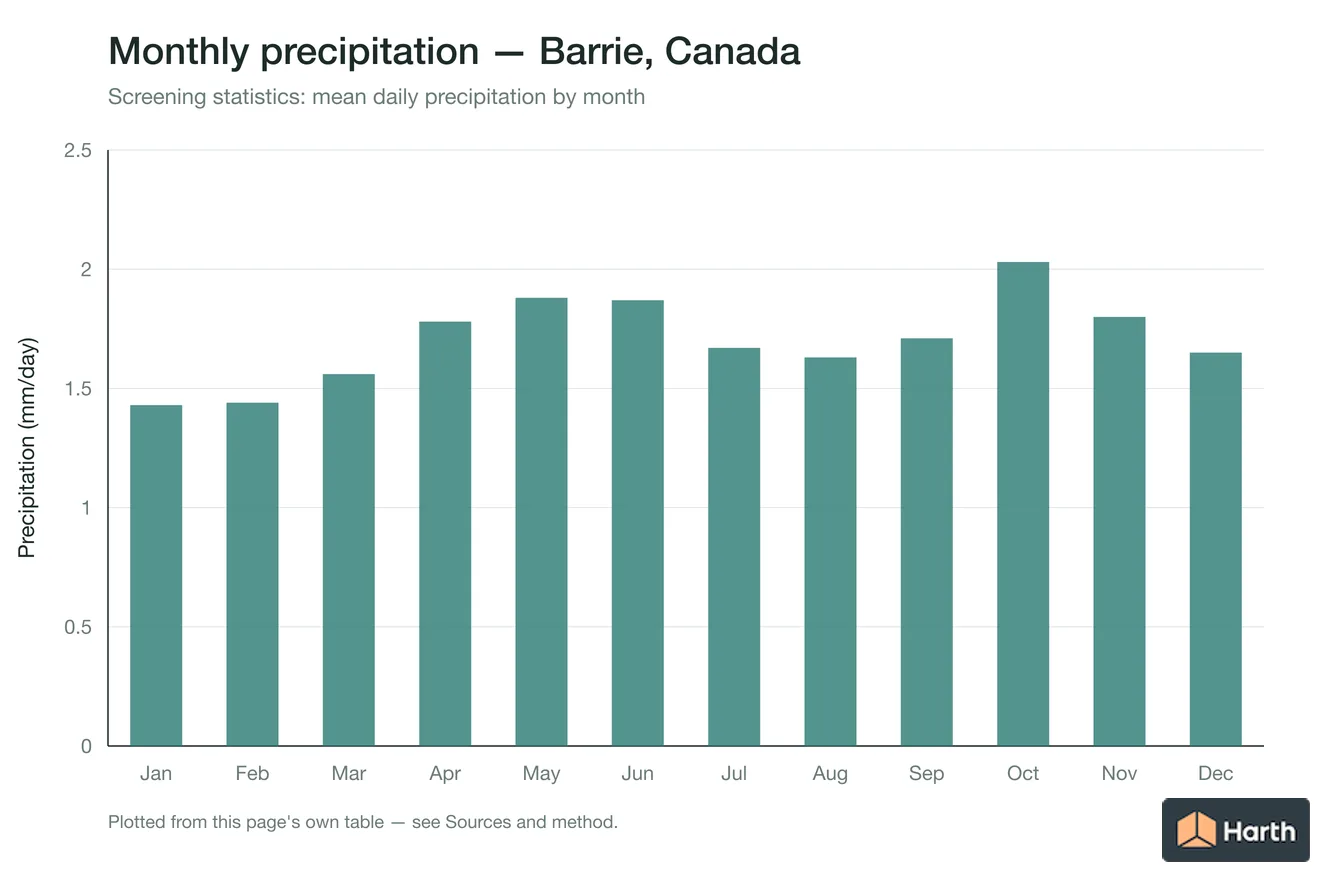
Month-by-month climate interpretation
- January: mean temperature -6.44 °C is 13.89 °C below the annual mean; the monthly max–min span is 37.83 °C. Relative humidity is 90.75% (12.06 points above annual), while corrected precipitation at 1.43 mm/day is 0.28 mm/day drier than the annual daily rate.
- February: mean temperature -6.39 °C is 13.84 °C below the annual mean; the monthly max–min span is 40.38 °C. Relative humidity is 89.41% (10.72 points above annual), while corrected precipitation at 1.44 mm/day is 0.27 mm/day drier than the annual daily rate.
- March: mean temperature -1.68 °C is 9.13 °C below the annual mean; the monthly max–min span is 52.59 °C. Relative humidity is 82.68% (3.99 points above annual), while corrected precipitation at 1.56 mm/day is 0.15 mm/day drier than the annual daily rate.
- April: mean temperature 4.69 °C is 2.76 °C below the annual mean; the monthly max–min span is 36.40 °C. Relative humidity is 77.47% (1.22 points below annual), while corrected precipitation at 1.78 mm/day is 0.07 mm/day wetter than the annual daily rate.
- May: mean temperature 11.44 °C is 3.99 °C above the annual mean; the monthly max–min span is 33.68 °C. Relative humidity is 75.21% (3.48 points below annual), while corrected precipitation at 1.88 mm/day is 0.17 mm/day wetter than the annual daily rate.
- June: mean temperature 17.35 °C is 9.90 °C above the annual mean; the monthly max–min span is 30.72 °C. Relative humidity is 72.16% (6.53 points below annual), while corrected precipitation at 1.87 mm/day is 0.16 mm/day wetter than the annual daily rate.
- July: mean temperature 21.28 °C is 13.83 °C above the annual mean; the monthly max–min span is 26.63 °C. Relative humidity is 67.84% (10.85 points below annual), while corrected precipitation at 1.67 mm/day is 0.04 mm/day drier than the annual daily rate.
- August: mean temperature 20.85 °C is 13.40 °C above the annual mean; the monthly max–min span is 24.38 °C. Relative humidity is 68.53% (10.16 points below annual), while corrected precipitation at 1.63 mm/day is 0.08 mm/day drier than the annual daily rate.
- September: mean temperature 17.09 °C is 9.64 °C above the annual mean; the monthly max–min span is 29.57 °C. Relative humidity is 71.10% (7.59 points below annual), while corrected precipitation at 1.71 mm/day is 0.00 mm/day wetter than the annual daily rate.
- October: mean temperature 9.70 °C is 2.25 °C above the annual mean; the monthly max–min span is 31.48 °C. Relative humidity is 77.83% (0.86 points below annual), while corrected precipitation at 2.03 mm/day is 0.32 mm/day wetter than the annual daily rate.
- November: mean temperature 3.27 °C is 4.18 °C below the annual mean; the monthly max–min span is 32.30 °C. Relative humidity is 82.96% (4.27 points above annual), while corrected precipitation at 1.80 mm/day is 0.09 mm/day wetter than the annual daily rate.
- December: mean temperature -2.62 °C is 10.07 °C below the annual mean; the monthly max–min span is 35.61 °C. Relative humidity is 88.88% (10.19 points above annual), while corrected precipitation at 1.65 mm/day is 0.06 mm/day drier than the annual daily rate.
Harth retrieved this point climatology from NASA POWER API v2.9.7 for location record 5894171. It is a reproducible screening dataset, not an hourly weather file, forecast, code design condition or substitute for local professional review.
Where can you explore related guidance?
- Explore all climate data guidance
- Climate Design Data: Oshawa, Canada
- Climate Design Data: Kitchener, Canada
- Climate Design Data: London, Canada
- All climate & energy design data guidance for Canada
- House Construction Cost Planning: Barrie, Canada
- Office Construction Cost Planning: Barrie, Canada
- Retail Construction Cost Planning: Barrie, Canada
- School Construction Cost Planning: Barrie, Canada
Sources and method
Location data from the GeoNames CA dump (CC BY 4.0, snapshot 2026-08-31, GeoNames ID 5894171). Regulatory starting point: Codes Canada and the applicable provincial or territorial authority. Figures are illustrative — verify against the current locally adopted edition for the site. Climate screening data from the NASA POWER Climatology API documentation and exact point response, retrieved 2026-08-31; source period: 20-year Meteorological and Solar Monthly & Annual Climatologies (January 2001 - December 2020). NASA POWER values are gridded screening statistics, not code design conditions or guaranteed local observations.
Source links
Frequently asked questions
What does NASA POWER climatology show for Barrie?
For the Barrie reference point, the 2001–2020 NASA POWER climatology reports 7.5 °C annual mean temperature, 78.7% relative humidity and 1.71 mm/day corrected precipitation. The monthly maximum peaks at 34.0 °C in August.
Can the Barrie climatology replace project design temperatures or an hourly weather file?
No. The Barrie response is gridded monthly climatology; its lowest monthly minimum of -29.8 °C in March is not a code percentile or observed site extreme. Verify elevation, local exposure, the required weather file or design-condition source and the current adopted code.
Related pages
- Climate Design Data: Aurangabad, India
Aurangabad, India climate design data (NASA POWER 2001–2020): annual mean 25.7 °C, monthly max 44.9 °C (May), min 6.5 °C (December), RH 54%; monthly table.
- Climate Design Data: Bacolod City, Philippines
Bacolod City, Philippines climate design data (NASA POWER 2001–2020): annual mean 25.2 °C, monthly max 39.0 °C (May), min 17.1 °C (January), RH 86%.
- Climate Design Data: Ballarat, Australia
Ballarat, Australia climate design data (NASA POWER 2001–2020): annual mean 12.6 °C, monthly max 43.3 °C (February), min -2.5 °C (August), RH 73%.
- Climate Design Data: Bauchi, Nigeria
Bauchi, Nigeria climate design data (NASA POWER 2001–2020): annual mean 26.6 °C, monthly max 42.8 °C (April), min 7.6 °C (January), RH 48%; monthly table.
- Climate Design Data: Belfast, UK
Belfast, UK climate design data (NASA POWER 2001–2020): annual mean 9.8 °C, monthly max 23.3 °C (July), min -1.6 °C (February), RH 88%; monthly table.
- Climate Design Data: Bendigo, Australia
Bendigo, Australia climate design data (NASA POWER 2001–2020): annual mean 13.7 °C, monthly max 44.5 °C (January), min -2.5 °C (July), RH 70%; monthly table.