Solar & Daylight Data
Solar Shading Design: Perth, Australia
Which months need shading in Perth, Australia, and how much sun overhangs and fins block on each facade.
On this page
Last updated September 25, 2026 · Location: GeoNames point -31.9522, 115.8614 ([GeoNames AU dump](https://download.geonames.org/export/dump/AU.zip), CC BY 4.0, ID 2063523); time zone Australia/Perth from the same GeoNames record. Sun positions, sunrise and sunset calculated by Harth with [NOAA's solar calculator equations](https://gml.noaa.gov/grad/solcalc/calcdetails.html), including standard atmospheric refraction, for a sea-level horizon. Sunlight, cloud and air temperature: [NASA POWER climatology](https://power.larc.nasa.gov/docs/services/api/temporal/climatology/) monthly means for 2001–2020 at this point (API v2.10.0, retrieved 2026-09-25).
Direct answer
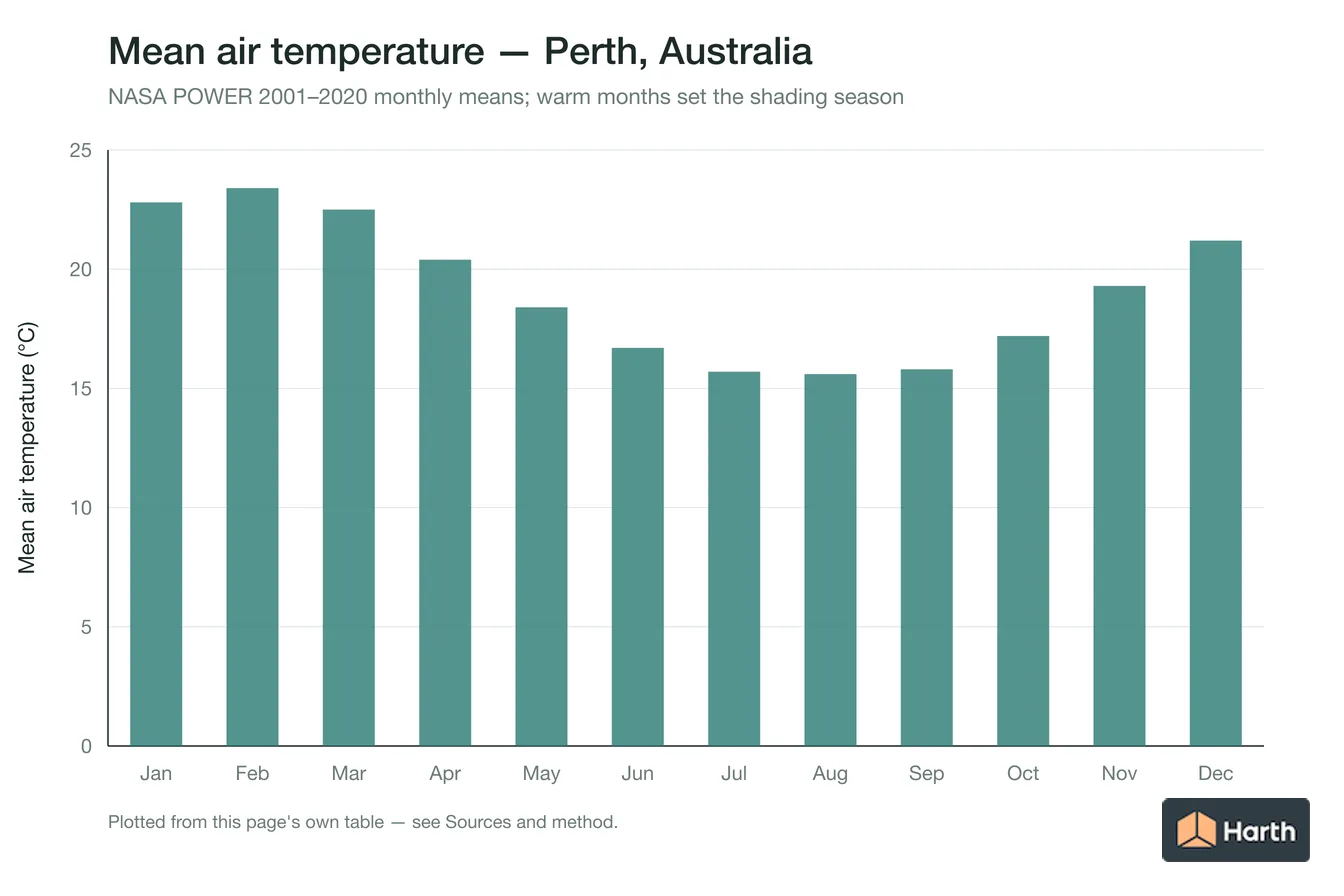
Perth has 7 warm months (November to May) with mean air temperature of 18 °C or more. Through them an overhang projecting 1.29 times the window height fully shades a north-facing window at noon. East and west windows get 6.3 hours of direct sun a day, and a P:H 1.0 overhang stops only 45% of it. The warmest month averages 23.4 °C. On the north facade a P:H 1.0 overhang blocks 72% of the warm-month direct sun. Fins with a depth equal to the window width block 25% (east) and 24% (west) of the east- and west-facade sun. The south facade gets 3.5 hours of direct sun a day in November to May.
Content and cited inputs reviewed by Harth team · Published 2026-08-26 · Updated 2026-09-25.
Which months need shading in Perth?
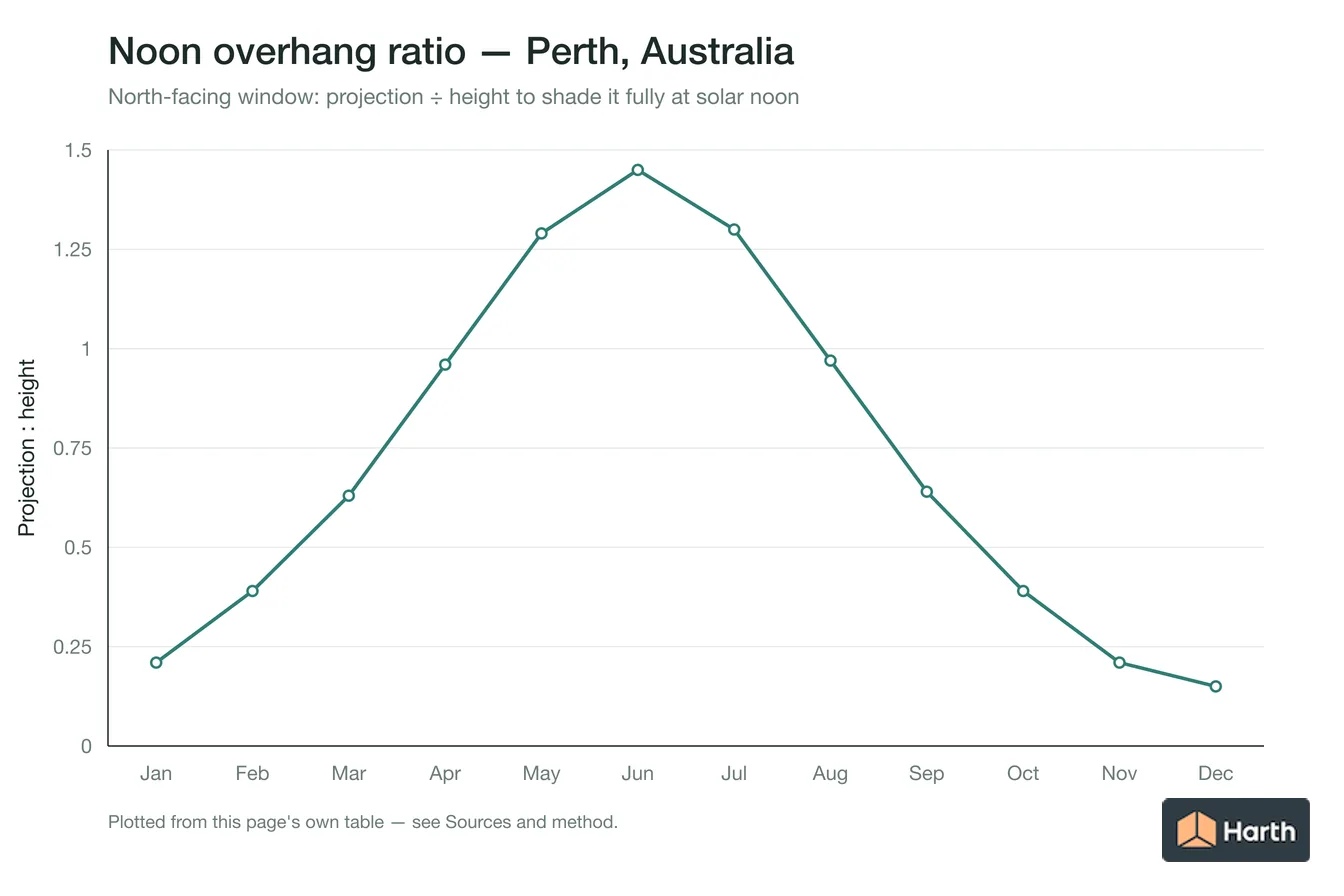
Warm months are those whose NASA POWER mean air temperature is 18 °C or higher. The last column is the overhang projection, as a fraction of window height, that fully shades a north-facing window at solar noon on the 21st.
| Month | Mean air temp (°C) | Warm month | Noon altitude | North facade noon P:H |
|---|---|---|---|---|
| January | 22.8 | yes | 78.0° | 0.21 |
| February | 23.4 | yes | 68.6° | 0.39 |
| March | 22.5 | yes | 57.8° | 0.63 |
| April | 20.4 | yes | 46.2° | 0.96 |
| May | 18.4 | yes | 37.9° | 1.29 |
| June | 16.7 | no | 34.6° | 1.45 |
| July | 15.7 | no | 37.6° | 1.30 |
| August | 15.6 | no | 45.9° | 0.97 |
| September | 15.8 | no | 57.3° | 0.64 |
| October | 17.2 | no | 68.7° | 0.39 |
| November | 19.3 | yes | 78.0° | 0.21 |
| December | 21.2 | yes | 81.5° | 0.15 |
How much warm-month sun each Perth facade gets, and what blocks it
Averaged over the 21st of each warm month (November to May). Percentages are the share of the minutes the sun is on that facade during which the device fully shades the glazing. Overhang P:H is projection ÷ window height; fin D:W is fin depth ÷ window width, with a fin on each side.
| Facade | Direct sun (h/day) | Overhang P:H 0.5 | Overhang P:H 1.0 | Fins D:W 1.0 | Overhang + fins 1.0 |
|---|---|---|---|---|---|
| North | 9.1 | 48% | 72% | 66% | 88% |
| North-east | 7.8 | 30% | 56% | 42% | 74% |
| East | 6.3 | 26% | 45% | 25% | 48% |
| South-east | 4.7 | 33% | 51% | 64% | 67% |
| South | 3.5 | 47% | 62% | 100% | 100% |
| South-west | 4.8 | 33% | 51% | 63% | 68% |
| West | 6.3 | 26% | 45% | 24% | 47% |
| North-west | 7.9 | 30% | 56% | 42% | 73% |
What this means for shading design in Perth
The north facade is the easy one: the sun reaches it high in the sky, so a fixed horizontal overhang does most of the work (P:H 1.0 blocks 72% of its warm-month sun). East and west facades take low morning and afternoon sun that passes under any practical overhang; there, fins with D:W 1.0 block 25% (east) and 24% (west), and adjustable external blinds or screens are the dependable answer. The facade that keeps the most unblocked sun with both an overhang and fins at 1.0 is west.
How these figures were calculated
Sun positions come from NOAA's solar equations at the GeoNames point -31.9522, 115.8614, sampled every 10 minutes from sunrise to sunset on the 21st of each warm month. A facade is sunlit when the sun is above the horizon and in front of it; a device fully shades the window when the vertical shadow angle (overhang) or horizontal shadow angle (fins) exceeds its cut-off angle. Overhangs and fins are assumed to extend well past the window edges, and diffuse sky light, glass type and obstructions are not included. Air temperatures are NASA POWER 2001–2020 monthly means.
Where can you explore related guidance?
- Explore all solar data guidance
- Sun Path: Perth, Australia
- Solar Altitude & Azimuth: Perth, Australia
- Daylight & Orientation: Perth, Australia
- Solar Shading Design: Mandurah, Australia
- All solar & daylight data guidance for Australia
- Climate Design Data: Perth, Australia
- House Construction Cost Planning: Perth, Australia
- Office Construction Cost Planning: Perth, Australia
- Retail Construction Cost Planning: Perth, Australia
Sources and method
Location: GeoNames point -31.9522, 115.8614 (GeoNames AU dump, CC BY 4.0, ID 2063523); time zone Australia/Perth from the same GeoNames record. Sun positions, sunrise and sunset calculated by Harth with NOAA's solar calculator equations, including standard atmospheric refraction, for a sea-level horizon. Sunlight, cloud and air temperature: NASA POWER climatology monthly means for 2001–2020 at this point (API v2.10.0, retrieved 2026-09-25).
Source links
Frequently asked questions
How deep should a north-facing overhang be in Perth?
To shade a north-facing window fully at solar noon through Perth's warm months (November to May), the overhang should project 1.29 times the height from the overhang to the window sill; for a 1.5 m tall window that is about 1.93 m.
Do east and west windows in Perth need shading?
Yes. In November to May east and west windows in Perth get about 6.3 hours of direct sun a day, mostly at low angles: a P:H 1.0 overhang blocks only 45% of it, while fins with D:W 1.0 block 25% and 24%.
Which months need sun shading in Perth?
Using NASA POWER 2001–2020 monthly means, November to May average 18 °C or more in Perth. The warmest month averages 23.4 °C and the coolest 15.6 °C.
Related pages
- Solar Shading Design: Oshawa, Canada
Solar shading design for Oshawa, Canada: horizontal-overhang P:H ratios at 09:00, noon and 15:00 by month; June noon altitude 69.5°; sizing hand check.
- Solar Shading Design: Ottawa, Canada
Solar shading design for Ottawa, Canada: horizontal-overhang P:H ratios at 09:00, noon and 15:00 by month; June noon altitude 68.0°; sizing hand check.
- Solar Shading Design: Patna, India
Solar shading design for Patna, India: horizontal-overhang P:H ratios at 09:00, noon and 15:00 by month; June noon altitude 87.8°; sizing hand check.
- Solar Shading Design: Port Macquarie, Australia
Shading design for Port Macquarie, Australia: overhang P:H ratios at 09:00, noon and 15:00 by month; June noon altitude 35.1°.
- Solar Shading Design: Portlaoise, Ireland
Solar shading design for Portlaoise, Ireland: horizontal-overhang P:H ratios at 09:00, noon and 15:00 by month; June noon altitude 60.4°; sizing hand check.
- Solar Shading Design: Pune, India
Solar shading design for Pune, India: horizontal-overhang P:H ratios at 09:00, noon and 15:00 by month; June noon altitude 85.1°; sizing hand check.