Climate & Energy Design Data
Climate Design Data Workflow for Denver, CO
A source-first workflow for retrieving and recording building-design climate conditions for Denver, CO without mixing climate normals, code zones, and HVAC design percentiles.
On this page
Last updated August 31, 2026 · Licensed ASHRAE Climatic Design Information / Standard 169 station data plus the locally adopted energy code. Coordinates 39.7392° N (America/Denver) are approximate routing references. Figures are illustrative — confirm the representative station and current edition. Climate screening data from the [NASA POWER Climatology API documentation](https://power.larc.nasa.gov/docs/services/api/temporal/climatology/) and [exact point response](https://power.larc.nasa.gov/api/temporal/climatology/point?parameters=T2M%2CT2M_MAX%2CT2M_MIN%2CRH2M%2CPRECTOTCORR%2CWS10M&community=SB&longitude=-104.9903&latitude=39.7392&format=JSON), retrieved 2026-08-31; source period: 20-year Meteorological and Solar Monthly & Annual Climatologies (January 2001 - December 2020). NASA POWER values are gridded screening statistics, not code design conditions or guaranteed local observations.
Direct answer
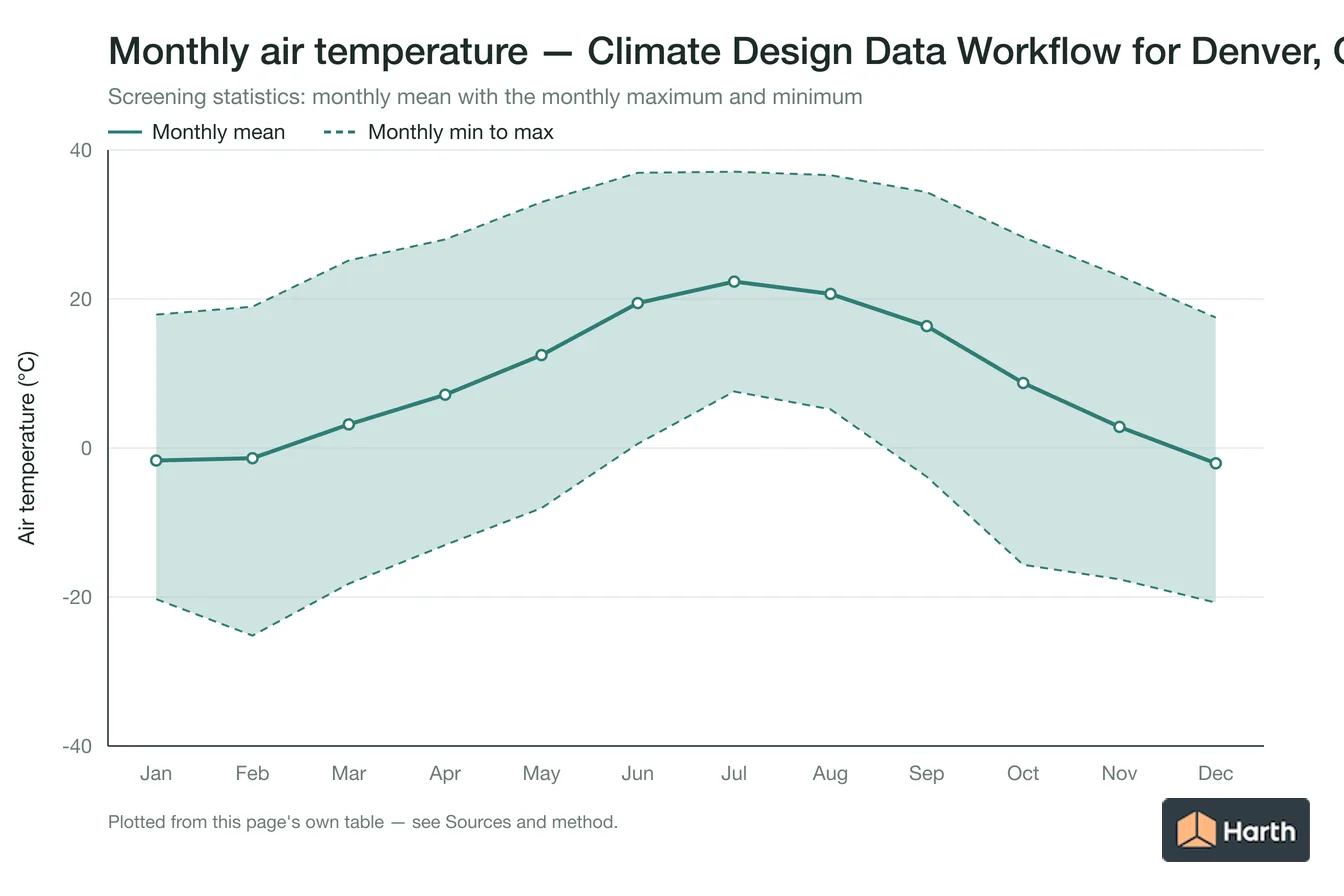
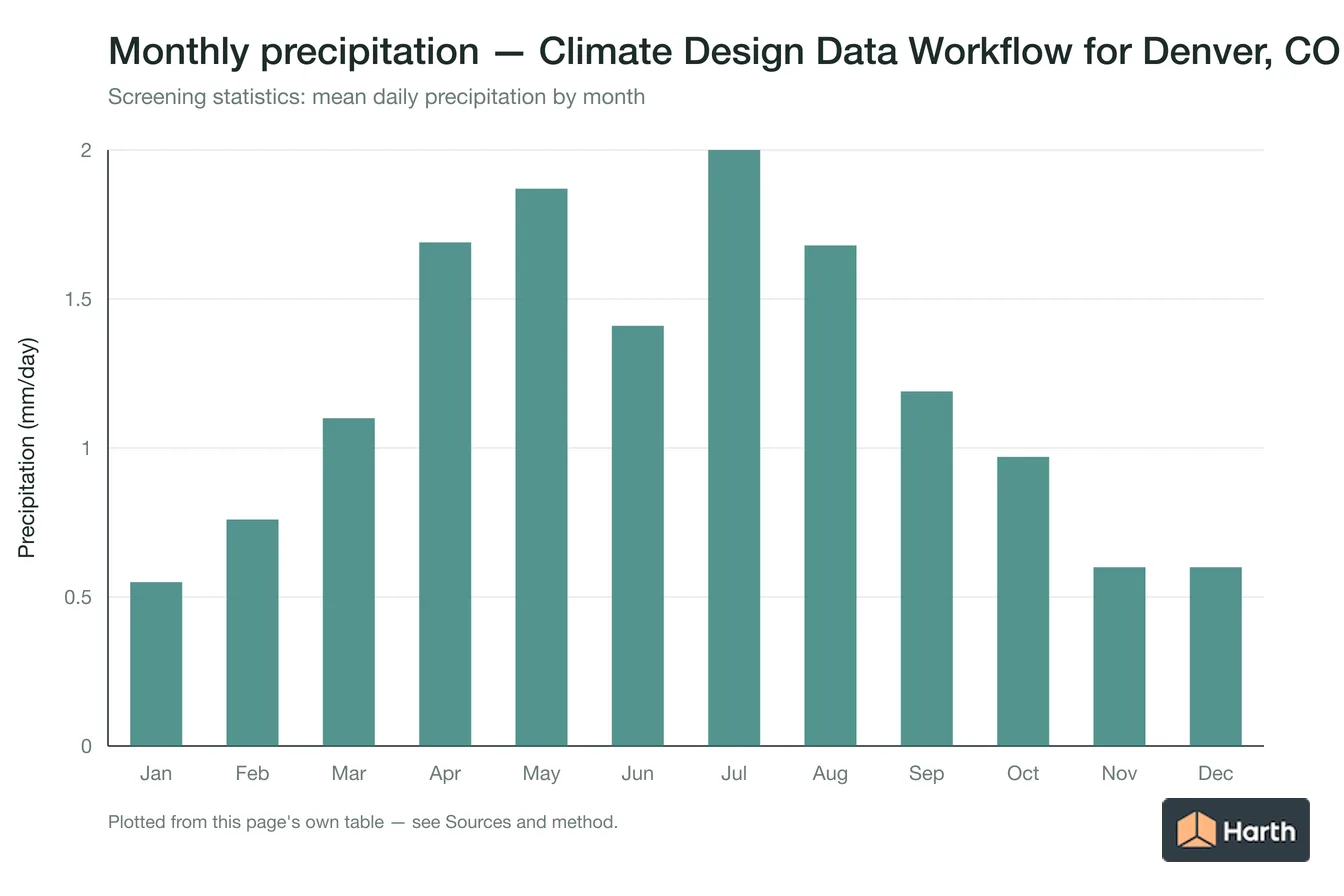
NASA POWER's 2001–2020 climatology at the Denver, CO reference point reports an annual mean 2 m temperature of 9.1 °C and relative humidity of 49.3%. The highest monthly maximum is 37.1 °C in July, while the lowest monthly minimum is -25.2 °C in February; these are screening statistics, not code design temperatures. The point response uses LST and the 20-year Meteorological and Solar Monthly & Annual Climatologies (January 2001 - December 2020); its annual corrected precipitation is 1.20 mm/day and annual 10 m wind speed is 3.83 m/s. Use the monthly series to screen source selection before applying project design conditions. NASA POWER is gridded climatology: verify elevation, microclimate, urban exposure, station or weather-file suitability, current code edition and the authority's required source before design use.
Content and cited inputs reviewed by Harth team · Published 2026-08-17 · Updated 2026-08-31.
Which climate inputs control the design?
- Confirm the project jurisdiction and adopted energy-code edition.
- Select the authoritative station and record why it applies.
- Record heating dry-bulb percentiles and cooling dry-bulb with coincident moisture conditions.
- Keep IP/SI units, edition, observation period and retrieval date with every value.
- Separate climate-zone envelope requirements from HVAC sizing conditions.
| Field | Required record |
|---|---|
| Station | Name, ID, coordinates and elevation |
| Source | Publisher, edition and licensed/public status |
| Heating | 99.6% and 99% dry-bulb |
| Cooling | 0.4%, 1% and 2% dry-bulb plus coincident wet-bulb |
| Moisture | Dew-point or humidity design condition used |
| Code | Adopted edition, amendments and effective date |
Denver, CO NASA POWER monthly climate screening table
| Month | Mean °C | Monthly max °C | Monthly min °C | RH % | Precipitation mm/day | Wind at 10 m m/s |
|---|---|---|---|---|---|---|
| January | -1.68 | 17.91 | -20.28 | 55.40 | 0.55 | 4.26 |
| February | -1.37 | 18.97 | -25.18 | 55.79 | 0.76 | 4.27 |
| March | 3.17 | 25.18 | -18.21 | 51.53 | 1.10 | 4.24 |
| April | 7.15 | 28.00 | -13.02 | 49.55 | 1.69 | 4.32 |
| May | 12.47 | 33.00 | -8.07 | 48.50 | 1.87 | 3.68 |
| June | 19.45 | 36.94 | 0.57 | 40.84 | 1.41 | 3.61 |
| July | 22.33 | 37.09 | 7.59 | 44.75 | 2.00 | 3.48 |
| August | 20.68 | 36.62 | 5.19 | 45.87 | 1.68 | 3.31 |
| September | 16.36 | 34.33 | -3.87 | 44.25 | 1.19 | 3.44 |
| October | 8.73 | 28.31 | -15.68 | 48.37 | 0.97 | 3.60 |
| November | 2.83 | 23.12 | -17.62 | 50.63 | 0.60 | 3.84 |
| December | -2.06 | 17.50 | -20.75 | 56.14 | 0.60 | 3.98 |
Month-by-month climate interpretation
- January: mean temperature -1.68 °C is 10.74 °C below the annual mean; the monthly max–min span is 38.19 °C. Relative humidity is 55.40% (6.11 points above annual), while corrected precipitation at 0.55 mm/day is 0.65 mm/day drier than the annual daily rate.
- February: mean temperature -1.37 °C is 10.43 °C below the annual mean; the monthly max–min span is 44.15 °C. Relative humidity is 55.79% (6.50 points above annual), while corrected precipitation at 0.76 mm/day is 0.44 mm/day drier than the annual daily rate.
- March: mean temperature 3.17 °C is 5.89 °C below the annual mean; the monthly max–min span is 43.39 °C. Relative humidity is 51.53% (2.24 points above annual), while corrected precipitation at 1.10 mm/day is 0.10 mm/day drier than the annual daily rate.
- April: mean temperature 7.15 °C is 1.91 °C below the annual mean; the monthly max–min span is 41.02 °C. Relative humidity is 49.55% (0.26 points above annual), while corrected precipitation at 1.69 mm/day is 0.49 mm/day wetter than the annual daily rate.
- May: mean temperature 12.47 °C is 3.41 °C above the annual mean; the monthly max–min span is 41.07 °C. Relative humidity is 48.50% (0.79 points below annual), while corrected precipitation at 1.87 mm/day is 0.67 mm/day wetter than the annual daily rate.
- June: mean temperature 19.45 °C is 10.39 °C above the annual mean; the monthly max–min span is 36.37 °C. Relative humidity is 40.84% (8.45 points below annual), while corrected precipitation at 1.41 mm/day is 0.21 mm/day wetter than the annual daily rate.
- July: mean temperature 22.33 °C is 13.27 °C above the annual mean; the monthly max–min span is 29.50 °C. Relative humidity is 44.75% (4.54 points below annual), while corrected precipitation at 2.00 mm/day is 0.80 mm/day wetter than the annual daily rate.
- August: mean temperature 20.68 °C is 11.62 °C above the annual mean; the monthly max–min span is 31.43 °C. Relative humidity is 45.87% (3.42 points below annual), while corrected precipitation at 1.68 mm/day is 0.48 mm/day wetter than the annual daily rate.
- September: mean temperature 16.36 °C is 7.30 °C above the annual mean; the monthly max–min span is 38.20 °C. Relative humidity is 44.25% (5.04 points below annual), while corrected precipitation at 1.19 mm/day is 0.01 mm/day drier than the annual daily rate.
- October: mean temperature 8.73 °C is 0.33 °C below the annual mean; the monthly max–min span is 43.99 °C. Relative humidity is 48.37% (0.92 points below annual), while corrected precipitation at 0.97 mm/day is 0.23 mm/day drier than the annual daily rate.
- November: mean temperature 2.83 °C is 6.23 °C below the annual mean; the monthly max–min span is 40.74 °C. Relative humidity is 50.63% (1.34 points above annual), while corrected precipitation at 0.60 mm/day is 0.60 mm/day drier than the annual daily rate.
- December: mean temperature -2.06 °C is 11.12 °C below the annual mean; the monthly max–min span is 38.25 °C. Relative humidity is 56.14% (6.85 points above annual), while corrected precipitation at 0.60 mm/day is 0.60 mm/day drier than the annual daily rate.
Harth retrieved this point climatology from NASA POWER API v2.9.7 for location record us:denver-co. It is a reproducible screening dataset, not an hourly weather file, forecast, code design condition or substitute for local professional review.
Where can you explore related guidance?
- Explore all climate data guidance
- ASHRAE / IECC Climate Zones Explained (Zones 1–8, A/B/C)
- Heating & Cooling Design Temperatures (99%, 1% / 0.4%)
- Climate Design Data Workflow for Albuquerque, NM
- Climate Design Data Workflow for Salt Lake City, UT
- Sun Path & Solar Angles for Denver, CO
Sources and method
Licensed ASHRAE Climatic Design Information / Standard 169 station data plus the locally adopted energy code. Coordinates 39.7392° N (America/Denver) are approximate routing references. Figures are illustrative — confirm the representative station and current edition. Climate screening data from the NASA POWER Climatology API documentation and exact point response, retrieved 2026-08-31; source period: 20-year Meteorological and Solar Monthly & Annual Climatologies (January 2001 - December 2020). NASA POWER values are gridded screening statistics, not code design conditions or guaranteed local observations.
Source links
Frequently asked questions
What does NASA POWER climatology show for Denver, CO?
For the Denver, CO reference point, the 2001–2020 NASA POWER climatology reports 9.1 °C annual mean temperature, 49.3% relative humidity and 1.20 mm/day corrected precipitation. The monthly maximum peaks at 37.1 °C in July.
Can the Denver, CO climatology replace project design temperatures or an hourly weather file?
No. The Denver, CO response is gridded monthly climatology; its lowest monthly minimum of -25.2 °C in February is not a code percentile or observed site extreme. Verify elevation, local exposure, the required weather file or design-condition source and the current adopted code.
Related pages
- Climate Design Data Workflow for Boston, MA
How architects should retrieve and document authoritative climate design conditions for Boston, MA, including station, percentile, units, edition, and code checks.
- Climate Design Data Workflow for Chicago, IL
How architects should retrieve and document authoritative climate design conditions for Chicago, IL, including station, percentile, units, edition, and code checks.
- Climate Design Data Workflow for Dallas, TX
How architects should retrieve and document authoritative climate design conditions for Dallas, TX, including station, percentile, units, edition, and code checks.
- Climate Design Data Workflow for Honolulu, HI
How architects should retrieve and document authoritative climate design conditions for Honolulu, HI, including station, percentile, units, edition, and code checks.
- Climate Design Data Workflow for Houston, TX
How architects should retrieve and document authoritative climate design conditions for Houston, TX, including station, percentile, units, edition, and code checks.
- Climate Design Data Workflow for Las Vegas, NV
How architects should retrieve and document authoritative climate design conditions for Las Vegas, NV, including station, percentile, units, edition, and code checks.