Climate & Energy Design Data
IECC Envelope Requirements by Climate Zone
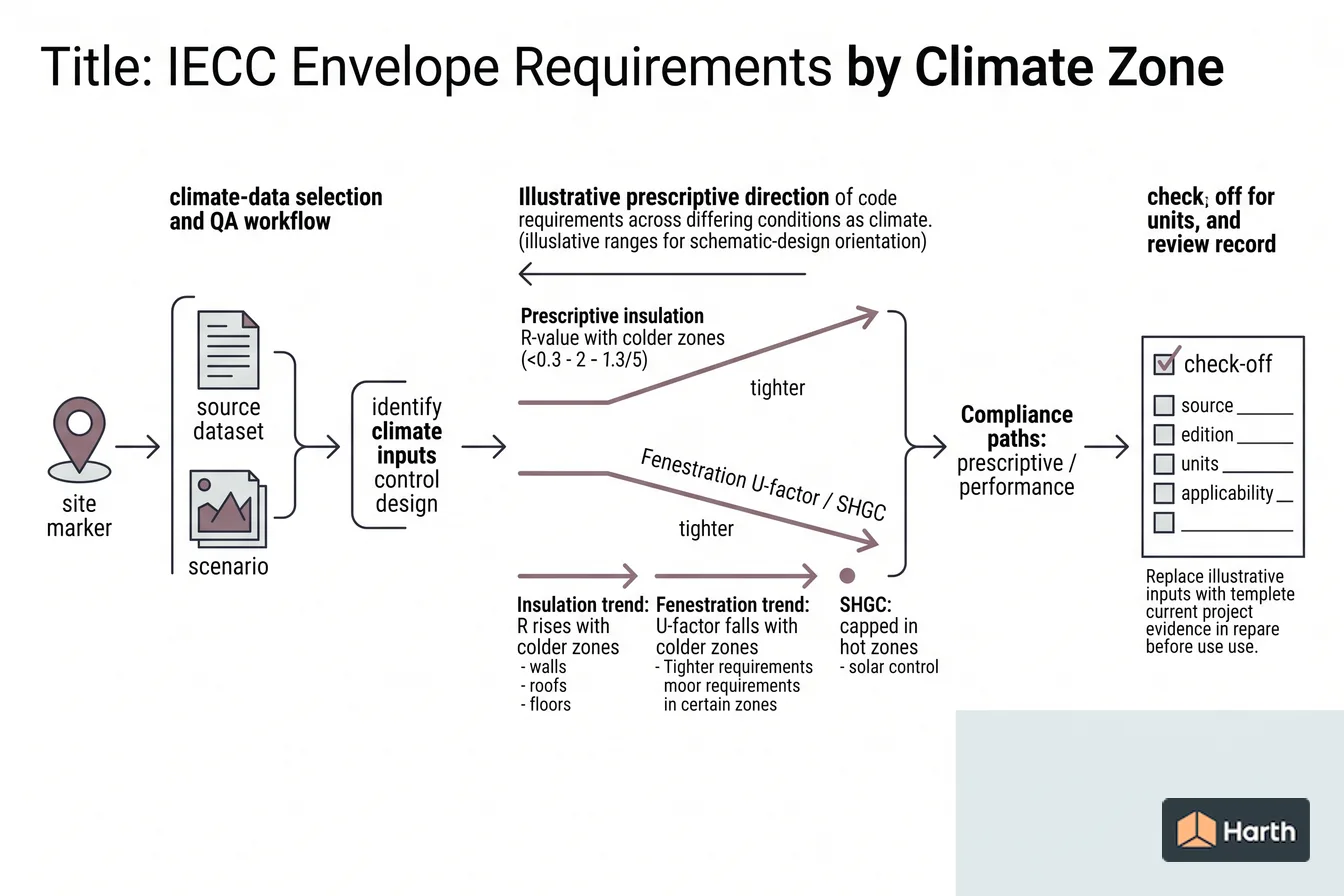
How prescriptive insulation R-values and fenestration U-factor / SHGC limits tighten as climate zones get colder, with illustrative ranges for schematic-design orientation.
On this page
Last updated August 14, 2026 · Illustrative prescriptive ranges reflecting the direction of IECC envelope tables across climate zones. Exact R-values, U-factors, and SHGC limits vary by code edition (e.g. 2018 / 2021 / 2024 IECC), residential vs. commercial, and local amendments. The AHJ-adopted energy code tables are authoritative; values here are not reproduced verbatim. Official references: [2024 IECC climate zones](https://codes.iccsafe.org/content/IECC2024V1.1/chapter-re-3-general-requirements).
Direct answer
How prescriptive insulation R-values and fenestration U-factor / SHGC limits tighten as climate zones get colder, with illustrative ranges for schematic-design orientation. A key reference is insulation trend: R rises with colder zones; check the cited source, edition, units, and applicability before using it for design, compliance, procurement, or approval. Insulation trend is R rises with colder zones; walls, roofs, floors. Fenestration trend is U-factor falls with colder zones; tighter in Zones 5–8. SHGC is capped in hot zones; Zones 1–3 solar control. The energy code's prescriptive envelope requirements move in a predictable direction as the climate zone gets colder: Read the values with the cited source, edition or observation period, units and applicability; replace illustrative inputs with current project evidence before design, procurement or approval use.
Content and cited inputs reviewed by Harth team · Published 2026-08-14 · Updated 2026-08-14.
Which climate inputs control the design?
The energy code's prescriptive envelope requirements move in a predictable direction as the climate zone gets colder:
- Insulation R-values rise for roofs, walls, and floors.
- Fenestration U-factors fall (windows must insulate better).
- SHGC is capped in hot zones to limit solar cooling load, and relaxed in cold zones where solar gain helps.
Illustrative prescriptive direction
The table below shows the direction and rough magnitude of prescriptive requirements — not the exact code numbers, which depend on edition, occupancy, and local amendments.
| Zone | Wall insulation (illustrative) | Window U-factor (illustrative) | SHGC (illustrative) |
|---|---|---|---|
| 1–2 (hot) | Lower R; cavity only | Higher U allowed (~0.40–0.50) | Low cap (~0.25) — solar control |
| 3 (warm) | Moderate R | ~0.32–0.40 | Capped (~0.25) |
| 4 (mixed) | Moderate + some continuous | ~0.30–0.35 | Around 0.40 or unrestricted (4C) |
| 5 (cool) | Higher R + continuous | ~0.30 | Unrestricted |
| 6 (cold) | High R + continuous | ~0.28–0.30 | Unrestricted |
| 7–8 (very cold) | Highest R; continuous emphasized | Lowest U (~0.26–0.28) | Unrestricted |
Values are illustrative and directional only.
What changes as you climb the zones
- Continuous insulation (ci) — largely optional in warm zones, increasingly required in Zones 5–8 to control thermal bridging through framing.
- Fenestration U-factor — the biggest single envelope lever in cold zones; triple glazing appears in Zones 6–8.
- SHGC — a cooling control that only binds in the hot zones (1–3); in cold zones lower SHGC would waste useful winter gain.
- Air leakage — tighter blower-door targets apply broadly, with more scrutiny in heating-dominated zones.
Reading the real tables
Use these ranges to bracket envelope targets at schematic design, then pull the exact numbers from the specific IECC (or ASHRAE 90.1) edition your AHJ has adopted — 2018, 2021, and 2024 differ, and states amend them. The prescriptive tables are organized by climate zone, so the zone lookup comes first.
IECC Envelope Requirements by Climate Zone (Insulation, U-factor, SHGC): climate-input traceability record
| Input | Project entry | Source record |
|---|---|---|
| Site coordinates and elevation | — | Survey / authoritative location source |
| Climate zone and governing edition | — | Official map, lookup and adoption record |
| Weather station / grid cell | — | Identifier, distance, elevation and fit |
| Observation period or weather-file vintage | — | Named dataset and release |
| Variable, percentile and units | — | Exact table / file / method |
| Intended use | — | Context, simulation, code or plant sizing |
| Local hazard source | — | Hazard-specific authority; not a zone proxy |
| Preparer, checker and date | — | Project QA record |
Project-use verification: never substitute a monthly normal for a design condition or a climate zone for a separate hazard lookup. Keep each input tied to its intended use.
Where can you explore related guidance?
- Explore all climate data guidance
- ASHRAE / IECC Climate Zones Explained (Zones 1–8, A/B/C)
- Heating & Cooling Design Temperatures (99%, 1% / 0.4%)
Sources and method
Illustrative prescriptive ranges reflecting the direction of IECC envelope tables across climate zones. Exact R-values, U-factors, and SHGC limits vary by code edition (e.g. 2018 / 2021 / 2024 IECC), residential vs. commercial, and local amendments. The AHJ-adopted energy code tables are authoritative; values here are not reproduced verbatim. Official references: 2024 IECC climate zones.
Source links
Frequently asked questions
Why do insulation requirements increase in colder zones?
Heat loss through the envelope scales with the indoor-to-outdoor temperature difference, which is far larger in cold zones. To keep heating loads and energy use reasonable, the code raises minimum R-values for roofs, walls, and floors and tightens fenestration U-factors as you move from Zone 1 toward Zone 8. Continuous insulation to control thermal bridging becomes prominent in the colder zones.
What is the difference between U-factor and SHGC for windows?
U-factor measures how readily heat conducts through the window assembly — lower is better, and it matters most in heating-dominated (cold) zones. SHGC (solar heat gain coefficient) measures how much solar radiation passes through — lower reduces cooling load, so it is capped in hot zones (1–3) and left unrestricted or high in the coldest zones where free solar gain is welcome.
Do I have to meet every prescriptive number?
Not necessarily. The prescriptive path is the simplest, but codes also allow a performance (whole-building energy) path and component trade-offs (the U-factor alternative or an ERI target), which let you exceed one requirement to relax another. Prescriptive tables are the fastest way to set schematic targets; a performance path can be used to optimize later.
Related pages
- Climate Design Data: Zaria, Nigeria
Zaria, Nigeria climate design data (NASA POWER 2001–2020): annual mean 24.4 °C, monthly max 41.2 °C (April), min 6.5 °C (January), RH 58%; monthly table.
- Climate Design Data: Zayed City, UAE
Zayed City, UAE climate design data (NASA POWER 2001–2020): annual mean 28.8 °C, monthly max 49.3 °C (June), min 6.0 °C (February), RH 42%; monthly table.
- Heating & Cooling Design Temperatures (99%, 1% / 0.4%)
Learn how 99% heating and 1% or 0.4% cooling design temperatures support equipment sizing, and why they are not record extremes.
- Climate & Energy Design Data: India
India climate & energy design data for architects: 37 city pages covering climate design data, each with a reproducible location record and source path.
- Climate & Energy Design Data: Ireland
Ireland climate & energy design data for architects: 20 city pages covering climate design data, each with a reproducible location record and source path.
- Climate & Energy Design Data: Kenya
Kenya climate & energy design data for architects: 27 city pages covering climate design data, each with a reproducible location record and source path.