Solar & Daylight Data
Understanding Sun-Path Diagrams
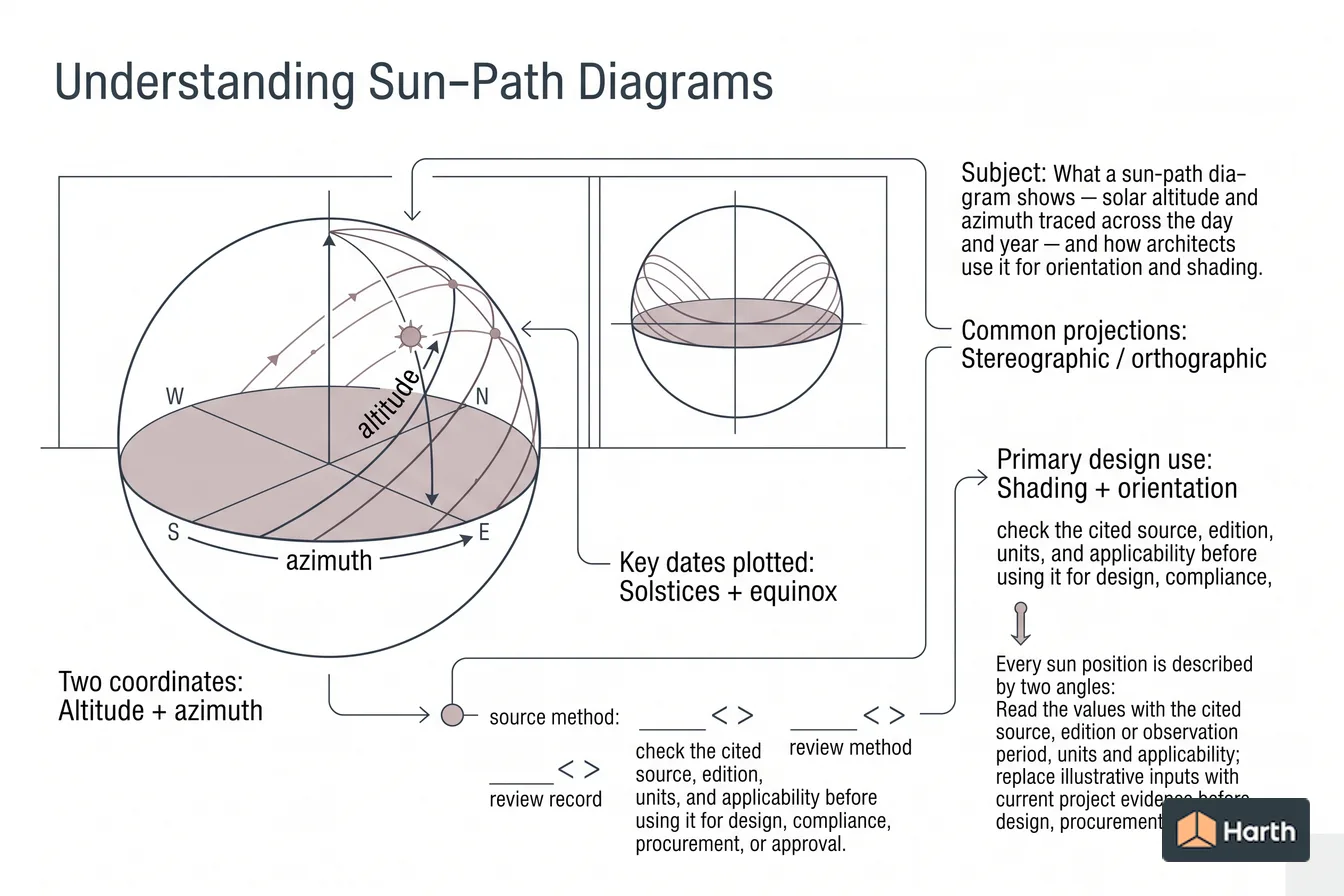
What a sun-path diagram shows — solar altitude and azimuth traced across the day and year — and how architects use it for orientation and shading.
On this page
Last updated August 14, 2026 · NOAA Solar Calculator / standard solar geometry equations; values are computed from latitude and date and are approximate (mean declination, no atmospheric refraction or equation-of-time correction). Official references: [NOAA solar calculation details](https://www.gml.noaa.gov/grad/solcalc/solareqns.PDF).
Direct answer
What a sun-path diagram shows — solar altitude and azimuth traced across the day and year — and how architects use it for orientation and shading. A key reference is two coordinates: Altitude + azimuth; check the cited source, edition, units, and applicability before using it for design, compliance, procurement, or approval. Two coordinates is Altitude + azimuth; height above horizon; compass bearing. Common projections is Stereographic / orthographic; polar vs. side view. Key dates plotted is Solstices + equinox; annual envelope of sun positions. A sun-path diagram maps where the sun appears in the sky for a specific latitude across the day and the year. Every sun position is described by two angles: Read the values with the cited source, edition or observation period, units and applicability; replace illustrative inputs with current project evidence before design, procurement or approval use.
Content and cited inputs reviewed by Harth team · Published 2026-08-14 · Updated 2026-08-14.
What does this term mean?
Understanding Sun-Path Diagrams: What a sun-path diagram shows — solar altitude and azimuth traced across the day and year — and how architects use it for orientation and shading.
Which solar conditions control the result?
A sun-path diagram maps where the sun appears in the sky for a specific latitude across the day and the year. Every sun position is described by two angles:
- Altitude — the sun's height above the horizon, from 0 degrees at the horizon to 90 degrees at the zenith.
- Azimuth — the sun's compass bearing, measured in degrees from north (or sometimes from south), telling you which direction the light comes from.
Together, altitude and azimuth locate the sun exactly. A sun-path diagram simply plots that pair for every hour, on a set of representative dates, onto a single chart tied to one latitude.
Stereographic vs. orthographic projection
The sky dome is three-dimensional, so it has to be flattened to fit on paper. Two projections dominate:
| Projection | Viewpoint | Reads well for | Trade-off |
|---|---|---|---|
| Stereographic (polar) | Looking down on the sky dome | Azimuth / orientation | Altitude spacing distorts near the zenith |
| Orthographic | Looking at the sky in elevation | Altitude / sun height | East-west azimuth compresses at the edges |
The date curves (near-horizontal) run between the summer and winter solstice paths, and the hour lines (the fanning curves) mark the time of day. Their intersections are individual sun positions.
How architects use it
- Orientation — see which facades receive direct sun, when, and from what bearing, to place primary rooms, glazing, and solar collectors deliberately.
- Shading design — overlay a proposed overhang or fin and read directly whether it blocks the high summer sun while admitting the low winter sun.
- Obstruction studies — plot neighboring buildings, trees, or terrain onto the same chart to find when a site is actually overshadowed.
- Daylighting — reason about penetration depth and glare risk before committing to a glazing layout.
From diagram to angles
The diagram is a visual index of the underlying geometry. When you need the actual numbers — the altitude to size an overhang, or the azimuth of a low winter sun striking a west facade — compute them from latitude and date. See solar altitude and azimuth explained for the definitions and equations, and sun path and solar angles for Phoenix, AZ for a worked city example.
Understanding Sun-Path Diagrams: reproducibility record
| Solar input | Project entry |
|---|---|
| Latitude / longitude and coordinate source | — |
| Time zone and daylight-saving treatment | — |
| Date, clock time and time basis | — |
| North convention and surface orientation | — |
| Solar-position algorithm / software and version | — |
| Atmospheric or horizon assumptions | — |
| Calculated altitude / azimuth and units | — |
| Independent check and reviewer | — |
Project-use verification: retain the inputs and method with every plotted result. A diagram without its coordinates, time basis and algorithm is illustrative only.
Where can you explore related guidance?
- Explore all solar data guidance
- Solar Altitude and Azimuth: Meaning, Formulas & Worked Example
- Sun Path & Solar Angles for Phoenix, AZ
Sources and method
NOAA Solar Calculator / standard solar geometry equations; values are computed from latitude and date and are approximate (mean declination, no atmospheric refraction or equation-of-time correction). Official references: NOAA solar calculation details.
Source links
Frequently asked questions
What is the difference between a stereographic and an orthographic sun-path diagram?
Both plot the sun's altitude and azimuth, but from different viewpoints. A stereographic (polar) diagram looks straight down on the sky dome: the horizon is the outer circle, the zenith is the center, and the observer stands at the middle. It is the most common form and reads like a compass. An orthographic diagram projects the same paths onto a vertical plane — a side elevation of the sky — which makes altitude easier to read directly against the horizon but compresses the east-west azimuth. Architects usually use stereographic for orientation studies and orthographic when they want a clean read of sun height for overhang design.
How do I read a specific sun position off the diagram?
Find the date curve (the near-horizontal lines run from one solstice to the other) and the hour line (the curves that fan from morning to evening). Their intersection is the sun's position at that date and time. Read altitude as the distance from the horizon toward the center, and azimuth as the compass bearing around the edge. That single point tells you whether the sun will strike a given facade and from what angle.
Why plot the solstices and equinox specifically?
Those three dates bracket the sun's annual range. The summer solstice path is the highest and widest arc, the winter solstice the lowest and narrowest, and the equinox sits between them with the sun rising due east and setting due west. If a shading device works for all three, it works for the whole year, so they are the standard design check points.
Related pages
- Sun Path: Yola, Nigeria
Sun path for Yola, Nigeria: solar-noon altitude 75.8° June, 80.8° equinox, 57.4° December; 11.5–12.5 h daylight; 12-month geometry table.
- Sun Path: Zamboanga, Philippines
Sun path for Zamboanga, Philippines: solar-noon altitude 73.5° June, 83.1° equinox, 59.7° December; 11.6–12.4 h daylight; 12-month geometry table.
- Sun Path: Zaria, Nigeria
Sun path for Zaria, Nigeria: solar-noon altitude 77.7° June, 78.9° equinox, 55.5° December; 11.3–12.7 h daylight; 12-month geometry table.
- Sun Path: Zayed City, UAE
Sun path for Zayed City, UAE: solar-noon altitude 89.8° June, 66.3° equinox, 42.9° December; 10.5–13.5 h daylight; 12-month geometry table.
- Solar & Daylight Data: United Arab Emirates
United Arab Emirates solar & daylight data for architects: 44 city pages with reproducible location records and source paths.
- Solar & Daylight Data: United Kingdom
United Kingdom solar & daylight data for architects: 36 city pages covering sun path, each with a reproducible location record and source path.