Solar & Daylight Data
Daylight & Orientation: Darwin, Australia
Monthly and seasonal sunlight on each wall orientation and the roof in Darwin, Australia, with cloud cover.
On this page
Last updated September 25, 2026 · Location: GeoNames point -12.4611, 130.8418 ([GeoNames AU dump](https://download.geonames.org/export/dump/AU.zip), CC BY 4.0, ID 2073124); time zone Australia/Darwin from the same GeoNames record. Sun positions, sunrise and sunset calculated by Harth with [NOAA's solar calculator equations](https://gml.noaa.gov/grad/solcalc/calcdetails.html), including standard atmospheric refraction, for a sea-level horizon. Sunlight, cloud and air temperature: [NASA POWER climatology](https://power.larc.nasa.gov/docs/services/api/temporal/climatology/) monthly means for 2001–2020 at this point (API v2.10.0, retrieved 2026-09-25).
Direct answer
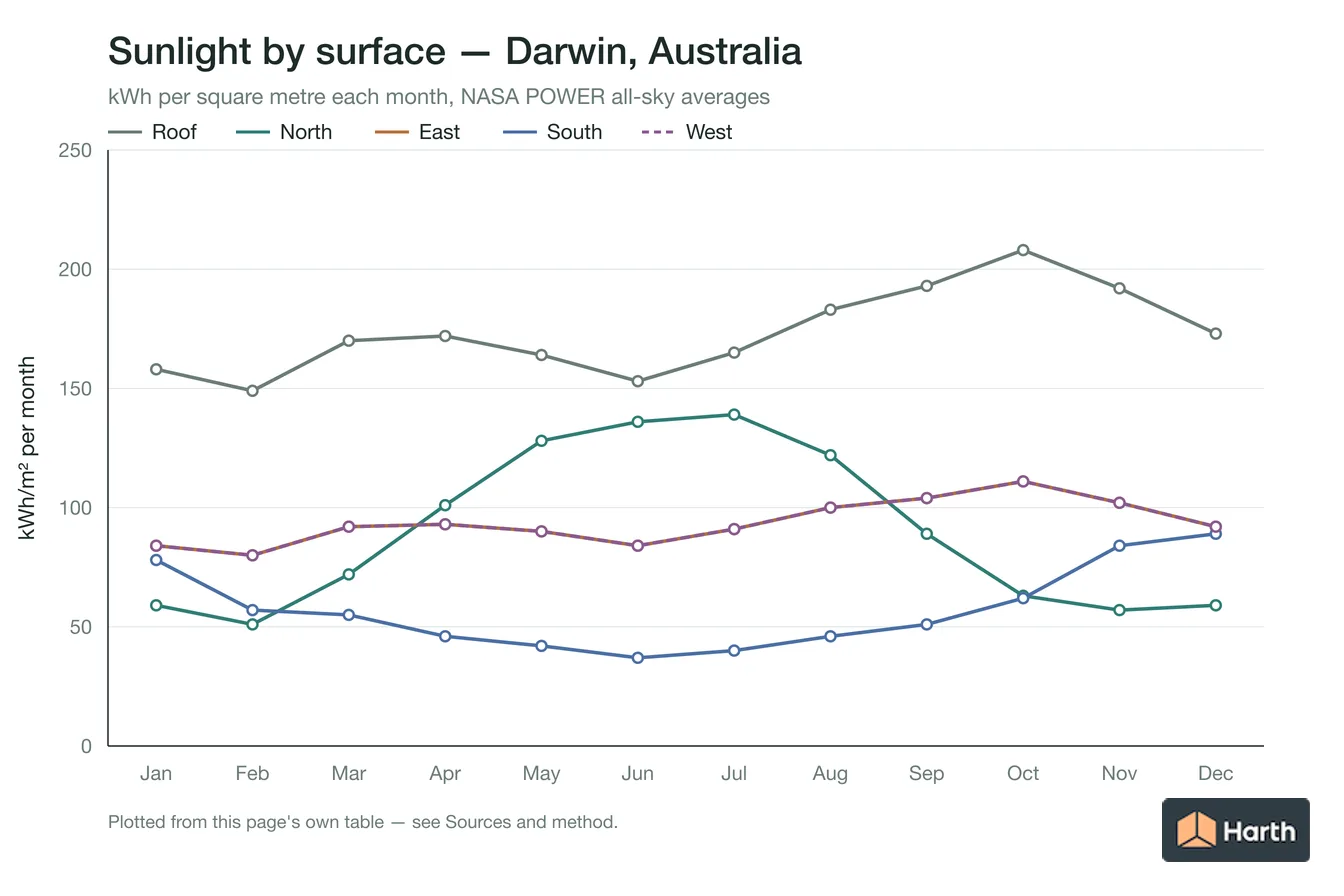
A north-facing wall in Darwin receives 1,078 kWh/m² of sunlight a year and 397 kWh/m² in June–August, the most winter sun of any wall. In December–February the east and west walls take the most, 256 kWh/m² each, while a south wall gets 687 kWh/m² a year. A flat roof receives 2,080 kWh/m² a year. Cloud cover averages 61%, lowest in July and highest in January. East and west walls each receive 1,123 kWh/m² a year, 23% of it in December–February. In July, the clearest month, a flat roof receives 5.3 kWh/m² a day and the clearness index reaches 0.67. North-east and north-west walls receive 1,149 and 1,148 kWh/m² a year; south-east and south-west walls 873 and 872.
Content and cited inputs reviewed by Harth team · Published 2026-08-26 · Updated 2026-09-25.
How much sunlight does each Darwin facade get, month by month?
Total solar energy reaching a square metre of wall or flat roof in each month, in kWh/m², from NASA POWER all-sky averages for 2001–2020.
| Month | Roof | North | East | South | West | Cloud cover |
|---|---|---|---|---|---|---|
| January | 158 | 59 | 84 | 78 | 84 | 91% |
| February | 149 | 51 | 80 | 57 | 80 | 85% |
| March | 170 | 72 | 92 | 55 | 92 | 79% |
| April | 172 | 101 | 93 | 46 | 93 | 57% |
| May | 164 | 128 | 90 | 42 | 90 | 49% |
| June | 153 | 136 | 84 | 37 | 84 | 46% |
| July | 165 | 139 | 91 | 40 | 91 | 41% |
| August | 183 | 122 | 100 | 46 | 100 | 41% |
| September | 193 | 89 | 104 | 51 | 104 | 44% |
| October | 208 | 63 | 111 | 62 | 111 | 51% |
| November | 192 | 57 | 102 | 84 | 102 | 66% |
| December | 173 | 59 | 92 | 89 | 92 | 84% |
Yearly and seasonal sunlight by orientation in Darwin
| Surface | Year (kWh/m²) | June–August | December–February | Share of year in December–February |
|---|---|---|---|---|
| Roof | 2,080 | 500 | 480 | 23% |
| North | 1,078 | 397 | 170 | 16% |
| North-east | 1,149 | 353 | 212 | 18% |
| East | 1,123 | 275 | 256 | 23% |
| South-east | 873 | 159 | 251 | 29% |
| South | 687 | 123 | 225 | 33% |
| South-west | 872 | 159 | 251 | 29% |
| West | 1,123 | 275 | 256 | 23% |
| North-west | 1,148 | 353 | 212 | 18% |
How clear the sky is over Darwin
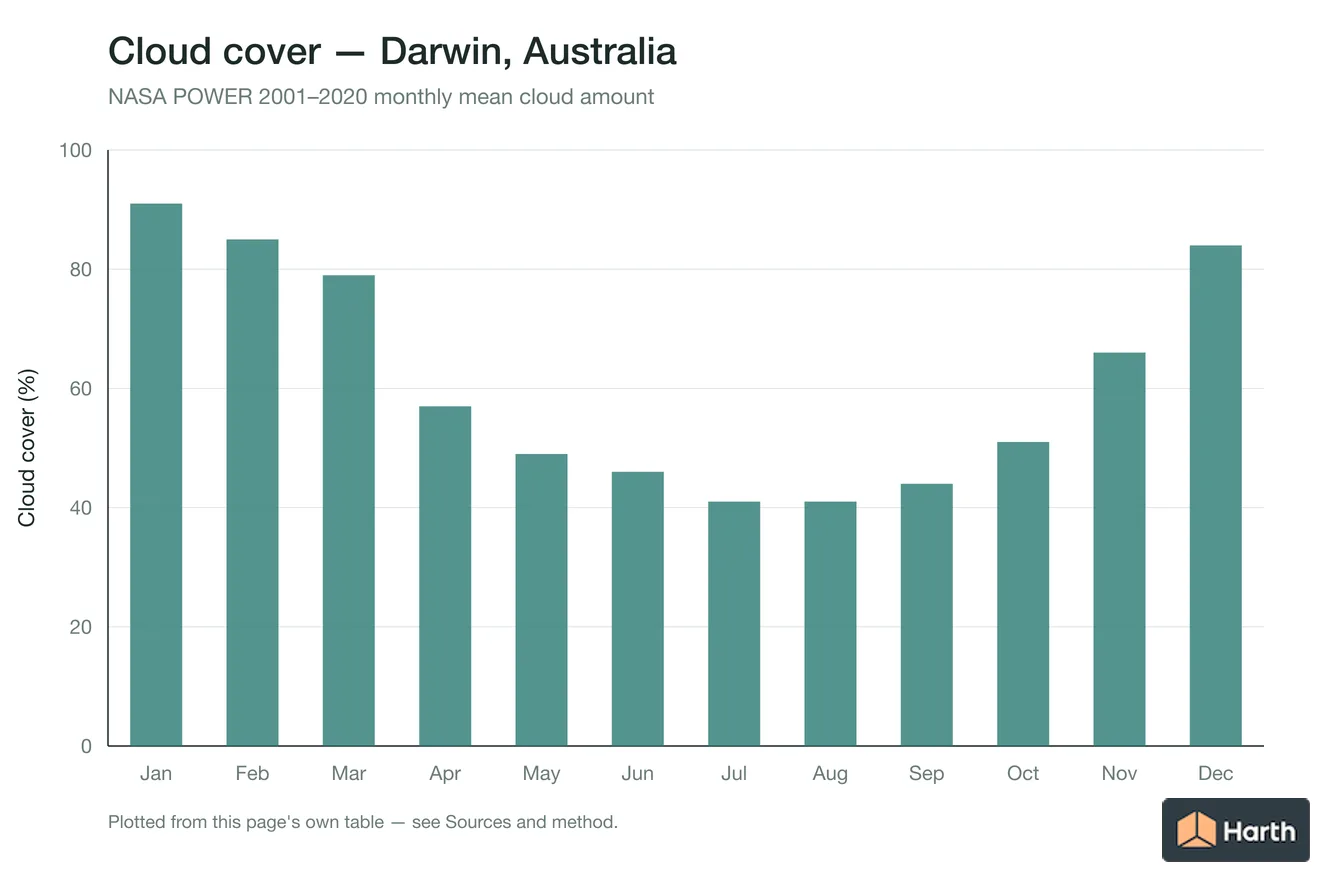
Cloud cover averages 61% over the year, from 41% in July to 91% in January. The clearness index — the share of sunlight above the atmosphere that reaches the ground — peaks at 0.67 in July. A flat roof receives 2,080 kWh/m² a year, 5.3 kWh/m² a day in July.
Choosing orientations in Darwin
For winter sun, the north facade is the one to glaze: it collects 397 kWh/m² over June–August, against 123 for the south facade. In December–February the east and west facades take the most sun, 256 kWh/m² each, so large glazing there needs external shading or low-g glass. The south facade gets the steadiest, mostly diffuse light — 687 kWh/m² a year — which suits studios and deep-plan rooms that need daylight without glare.
How these figures were calculated
NASA POWER gives mean daily global and diffuse sunlight on a horizontal surface for each month. Harth split each day into 10-minute steps with the Collares-Pereira & Rabl and Liu & Jordan profiles, projected each step onto vertical walls with an isotropic sky and ground reflectance of 0.2, and multiplied by the days in the month. East and west come out equal because the averages are symmetric about solar noon; on a real site, afternoon cloud, neighbouring buildings and trees change the split.
Where can you explore related guidance?
- Explore all solar data guidance
- Sun Path: Darwin, Australia
- Solar Altitude & Azimuth: Darwin, Australia
- Solar Shading Design: Darwin, Australia
- Sun Path: Ballarat, Australia
- Solar Altitude & Azimuth: Ballarat, Australia
- Solar Shading Design: Ballarat, Australia
- Daylight & Orientation: Ballarat, Australia
- Sun Path: Mandurah, Australia
- Solar Altitude & Azimuth: Mandurah, Australia
- Solar Shading Design: Mandurah, Australia
- Daylight & Orientation: Mandurah, Australia
- Sun Path: Bendigo, Australia
- Solar Altitude & Azimuth: Bendigo, Australia
- Solar Shading Design: Bendigo, Australia
- Daylight & Orientation: Bendigo, Australia
- Sun Path: Launceston, Australia
- Solar Altitude & Azimuth: Launceston, Australia
- Solar Shading Design: Launceston, Australia
- Daylight & Orientation: Launceston, Australia
- Sun Path: Maitland, Australia
- Solar Altitude & Azimuth: Maitland, Australia
- Solar Shading Design: Maitland, Australia
- Daylight & Orientation: Maitland, Australia
- Sun Path: Mackay, Australia
- Solar Altitude & Azimuth: Mackay, Australia
- Solar Shading Design: Mackay, Australia
- Daylight & Orientation: Mackay, Australia
- Sun Path: Rockhampton, Australia
- Solar Altitude & Azimuth: Rockhampton, Australia
- Solar Shading Design: Rockhampton, Australia
- Daylight & Orientation: Rockhampton, Australia
- Sun Path: Coffs Harbour, Australia
- Solar Altitude & Azimuth: Coffs Harbour, Australia
- Solar Shading Design: Coffs Harbour, Australia
- Daylight & Orientation: Coffs Harbour, Australia
- Sun Path: Blue Mountains, Australia
- Solar Altitude & Azimuth: Blue Mountains, Australia
- Solar Shading Design: Blue Mountains, Australia
- Daylight & Orientation: Blue Mountains, Australia
- Sun Path: Bunbury, Australia
- Solar Altitude & Azimuth: Bunbury, Australia
- Solar Shading Design: Bunbury, Australia
- Daylight & Orientation: Bunbury, Australia
- Sun Path: Bundaberg, Australia
- Solar Altitude & Azimuth: Bundaberg, Australia
- Solar Shading Design: Bundaberg, Australia
- Daylight & Orientation: Bundaberg, Australia
- Sun Path: Hervey Bay, Australia
- Solar Altitude & Azimuth: Hervey Bay, Australia
- Solar Shading Design: Hervey Bay, Australia
- Daylight & Orientation: Hervey Bay, Australia
- Sun Path: Port Macquarie, Australia
- Solar Altitude & Azimuth: Port Macquarie, Australia
- Solar Shading Design: Port Macquarie, Australia
- Daylight & Orientation: Port Macquarie, Australia
- Sun Path: Sydney, Australia
- Solar Altitude & Azimuth: Sydney, Australia
- Solar Shading Design: Sydney, Australia
- Daylight & Orientation: Sydney, Australia
- Sun Path: Melbourne, Australia
- Solar Shading Design: Melbourne, Australia
- Daylight & Orientation: Melbourne, Australia
- Sun Path: Brisbane, Australia
- Solar Altitude & Azimuth: Brisbane, Australia
- Solar Shading Design: Brisbane, Australia
- Daylight & Orientation: Brisbane, Australia
- Sun Path: Perth, Australia
- Solar Altitude & Azimuth: Perth, Australia
- Solar Shading Design: Perth, Australia
- Daylight & Orientation: Perth, Australia
- Sun Path: Adelaide, Australia
- Solar Altitude & Azimuth: Adelaide, Australia
- Solar Shading Design: Adelaide, Australia
- Daylight & Orientation: Adelaide, Australia
- Sun Path: Gold Coast, Australia
- Solar Altitude & Azimuth: Gold Coast, Australia
- Solar Shading Design: Gold Coast, Australia
- Daylight & Orientation: Gold Coast, Australia
- Sun Path: Newcastle, Australia
- Solar Altitude & Azimuth: Newcastle, Australia
- Solar Shading Design: Newcastle, Australia
- Daylight & Orientation: Newcastle, Australia
- Sun Path: Sunshine Coast, Australia
- Solar Altitude & Azimuth: Sunshine Coast, Australia
- Solar Shading Design: Sunshine Coast, Australia
- Daylight & Orientation: Sunshine Coast, Australia
- Sun Path: Canberra, Australia
- Solar Altitude & Azimuth: Canberra, Australia
- Solar Shading Design: Canberra, Australia
- Daylight & Orientation: Canberra, Australia
- Sun Path: Central Coast, Australia
- Solar Altitude & Azimuth: Central Coast, Australia
- Solar Shading Design: Central Coast, Australia
- Daylight & Orientation: Central Coast, Australia
- Sun Path: Geelong, Australia
- Solar Altitude & Azimuth: Geelong, Australia
- Solar Shading Design: Geelong, Australia
- Daylight & Orientation: Geelong, Australia
- Sun Path: Wollongong, Australia
- Solar Altitude & Azimuth: Wollongong, Australia
- Solar Shading Design: Wollongong, Australia
- Daylight & Orientation: Wollongong, Australia
- Sun Path: Hobart, Australia
- Solar Altitude & Azimuth: Hobart, Australia
- Solar Shading Design: Hobart, Australia
- Daylight & Orientation: Hobart, Australia
- Sun Path: Townsville, Australia
- Solar Altitude & Azimuth: Townsville, Australia
- Solar Shading Design: Townsville, Australia
- Daylight & Orientation: Townsville, Australia
- Sun Path: Cairns, Australia
- Solar Altitude & Azimuth: Cairns, Australia
- Solar Shading Design: Cairns, Australia
- Daylight & Orientation: Cairns, Australia
- Sun Path: Toowoomba, Australia
- Solar Altitude & Azimuth: Toowoomba, Australia
- Solar Shading Design: Toowoomba, Australia
- Daylight & Orientation: Toowoomba, Australia
- All solar & daylight data guidance for Australia
- Climate Design Data: Darwin, Australia
- House Construction Cost Planning: Darwin, Australia
- Office Construction Cost Planning: Darwin, Australia
- Retail Construction Cost Planning: Darwin, Australia
Sources and method
Location: GeoNames point -12.4611, 130.8418 (GeoNames AU dump, CC BY 4.0, ID 2073124); time zone Australia/Darwin from the same GeoNames record. Sun positions, sunrise and sunset calculated by Harth with NOAA's solar calculator equations, including standard atmospheric refraction, for a sea-level horizon. Sunlight, cloud and air temperature: NASA POWER climatology monthly means for 2001–2020 at this point (API v2.10.0, retrieved 2026-09-25).
Source links
Frequently asked questions
Which way should a house face in Darwin for winter sun?
Face the main living spaces north. In Darwin a north-facing wall receives 397 kWh/m² of sunlight over June–August, compared with 275 for east or west and 123 for south.
How much sun does a west-facing wall get in Darwin in summer?
About 256 kWh/m² over December–February, 23% of its yearly 1,123 kWh/m², arriving as low afternoon sun that overhangs do not stop.
How cloudy is Darwin?
NASA POWER satellite records for 2001–2020 put Darwin's mean cloud cover at 61%, from 41% in July to 91% in January.
Related pages
- Daylight & Orientation: Coffs Harbour, Australia
Daylight for Coffs Harbour, Australia: day length 10.0–14.0 h, sunrise/sunset and noon bearing by month; June noon altitude 36.3°.
- Daylight & Orientation: Coimbatore, India
Daylight and orientation for Coimbatore, India: geometric day length 11.4–12.6 h, solar sunrise/sunset and noon bearing by month; June noon altitude 77.6°.
- Daylight & Orientation: Cork, Ireland
Daylight and orientation for Cork, Ireland: geometric day length 7.5–16.5 h, solar sunrise/sunset and noon bearing by month; June noon altitude 61.5°.
- Daylight & Orientation: Delhi, India
Daylight and orientation for Delhi, India: geometric day length 10.2–13.8 h, solar sunrise/sunset and noon bearing by month; June noon altitude 84.8°.
- Daylight & Orientation: Dhanbad, India
Daylight and orientation for Dhanbad, India: geometric day length 10.5–13.5 h, solar sunrise/sunset and noon bearing by month; June noon altitude 89.6°.
- Daylight & Orientation: Dibba Al-Fujairah, UAE
Daylight and orientation for Dibba Al-Fujairah, UAE: geometric day length 10.4–13.6 h, solar sunrise/sunset and noon bearing by month; June noon altitude 87.8°.